If you found this post via search, it probably makes sense to start with the first post in this series.
The prior posts in this series focused on what does matter relative to our economic vocabulary.
This post talks about what we focus on that matters, but either not very much, or not in the way we commonly think.
Table of Contents
What economic ideas do we give too much importance to?
- The national debt
- GDP
- The stock market
The national debt
What the national debt is
The vast majority of people who talk about “the economy” do not understand the distinction between “the currency issuer” and “currency users”.
Within any “currency zone” (what we typically refer to as “economies”) there is ONE currency issuer. It is generally the federal government.
I think Europe is the only weird situation because there is the European Union which (currently) consists of 27 countries, 19 of which use the euro and 8 of which don’t.
Within the Eurozone, the currency issuer is the European Central Bank, which is a European Union institution, it just doesn’t provide anything to 8 of the member nations.
Currency issuers issue currency
That’s probably not a very profound statement, but HOW do they do this?
Currency issuers spend money into existence
Generally through excessively complex operations, which I personally suspect were made complex on purpose to obscure the underlying simplicity of it, but currency issuers spend money into existence. Literally.
And they tax money out of existence. Literally.
THEN they sell bonds
They then sell bonds, which seems to be part of the complexity I mentioned earlier.
Those bond sales are the national debt.
Now to be clear, the central bank created the money, out of nothing, that was then used to buy the bonds.
So there is some “smoke and mirrors” going on here.
But in essence, the national debt of a currency-issuing nation (or currency zone) is the total of all the money spent into the economy minus all the money taxed out.
The national debt and money supply are related?
In a word, yes.
In order for there to even be money, there has to be a national debt.
When the national debt goes up, the amount of money in the economy grows.
When the national debt goes down, the amount of money in the economy shrinks.
Even weirder, it was never borrowed from anyone
Those bond sales I mentioned aren’t actually debt. They’re savings.
When you have money in a commercial bank checking account that pays no interest, and you use some of that money to buy a certificate of deposit that does pay interest, you’re simply moving money from one type of account to another.
When banks that have money in non-interest paying reserve accounts at a central bank use some of that money to buy interest-paying treasury bonds, they’re simply moving money from one type of account to another.
No borrowing is actually involved.
But it DOES matter
But not because there is anyone to pay it back to. There isn’t.
It matters because it’s the “seed” of our money supply.
If you look back in the history of the United States, every time the federal government paid down the national debt, a recession occurred a few years later.
Every time.
Why? Because the amount of money in the US economy shrank.
This chart shows “sectoral balances” and recessions
The chart below can look intimidating at first, so focus on the red, which represents what the chart calls “government sector” spending.
That’s a misnomer as it’s really “currency issuer” spending.
Blue is the private sector, or more accurately the currency user spending.
As you can see “government sector” spending goes up, private sector savings go up.
Why? Because private sector savings COME FROM public sector surpluses.
How? Because every dollar spent by someone goes to someone else.
And, for the same reason, every time public sector spending shrunk, private sector savings shrank as well.
Then compare public sector spending to recessions, and you’ll see it.

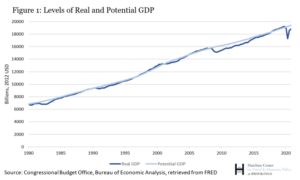
This chart shows % change is GDP and recessions
Maybe this next chart will help more.
It shows CHANGES in the national debt as compared to the previous year.
The verticle grey bars are when recessions occur.
As you can see, every recession is preceded by a decrease in the national debt.
Every one.

GDP
What GDP is
As you probably know, GDP stands for Gross Domestic Product.
Gross domestic product (GDP) is the total monetary or market value of all the finished goods and services produced within a country’s borders in a specific time period. As a broad measure of overall domestic production, it functions as a comprehensive scorecard of a given country’s economic health.
Investopedia: Gross Domestic Product (GDP)
It was developed in 1934 by an American economist named Simon Kuznets, who was later awarded the Nobel prize in Economic Science in 1971.
And even he had doubts about its validity as a measure of “production” when it included building and selling weapons of war as well as nonproductive financial speculation.
What’s wrong with how we measure GDP?
As stated above, in its measure of “domestic production”, things are included that clearly are not productive, do not add value.
As mentioned above, GDP counts as productive the manufacturing and sale of weapons of war, which are by their very nature destructive, as well as financial speculation, which diverts money away from productive uses that add value to an economy.
But in addition, as mentioned previously in this series of blog posts, GDP does not properly value unpaid and underpaid care work, which is essential to the productive activity which is properly valued.
After all, somebody has to watch the kids while Mom and Dad are at work.
The stock market
Stock ownership is low
The number of Americans who own stock is declining. Down from a high of 63% in 2004 to 56% today.
Corporate stock buybacks artifically inflate prices
The prices of many stocks are artificially inflated by corporate stock buybacks, which was illegal stock price manipulation prior to 1982.
Half of American adults are broke
Half of all adult Americans would have trouble paying for a $400 emergency expense. 19 percent of adults simply could not cover that expense at all.
And therefore…
Using stock market valuations as an indication of overall economic health is disconnected from the realities of the American economy.
I know there are people who say different, but just look at the evidence presented above.
So while the valuations of the stock markets matter, they matter as an indication of how wide our wealth inequality has become, not as an indication of the overall health of our economy.